Devoured
Data Visualisation
Year 4 University Project
The project
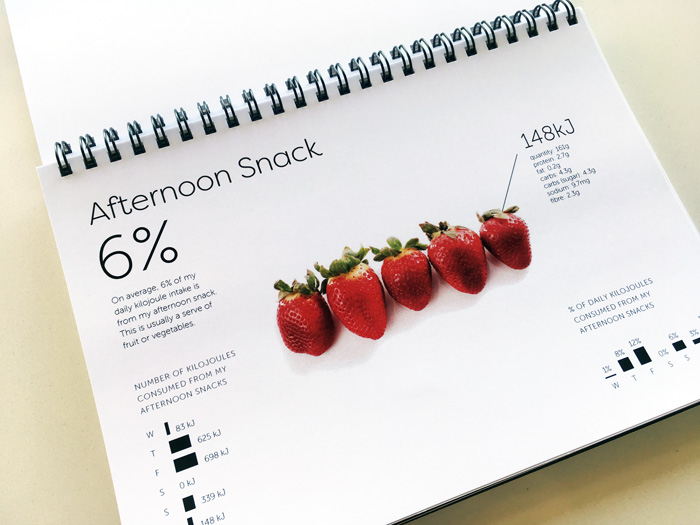
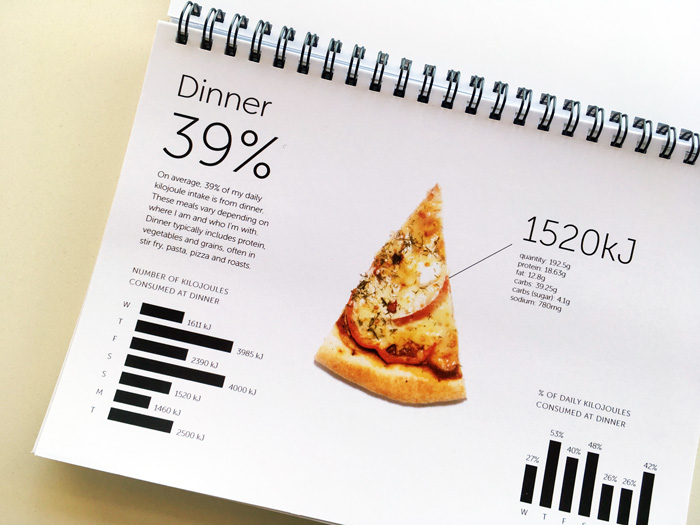
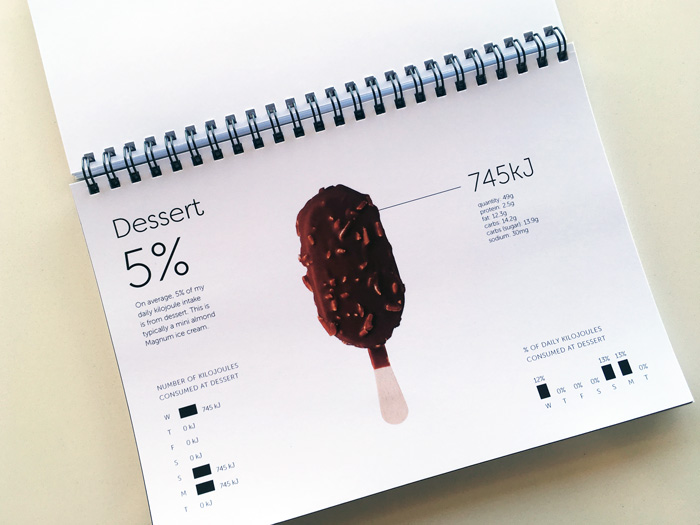
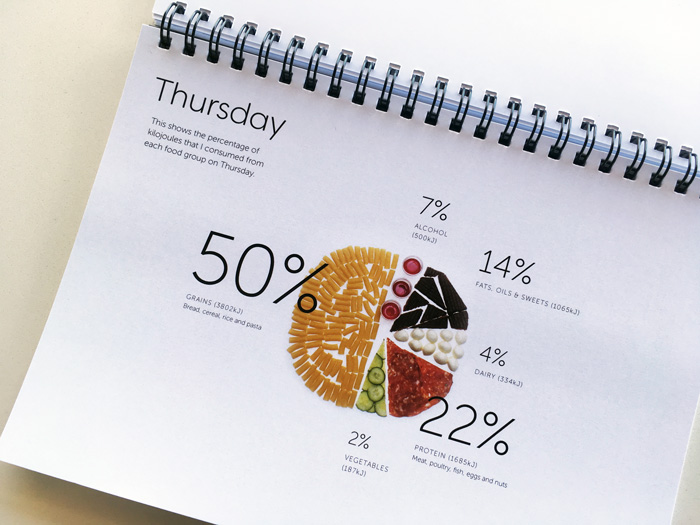
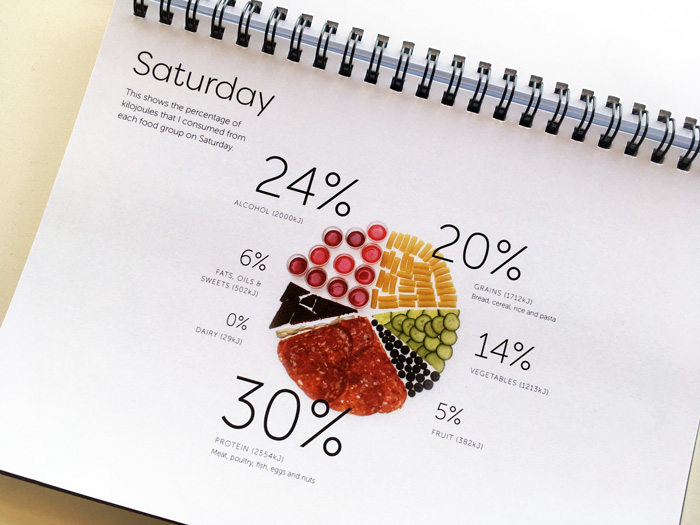
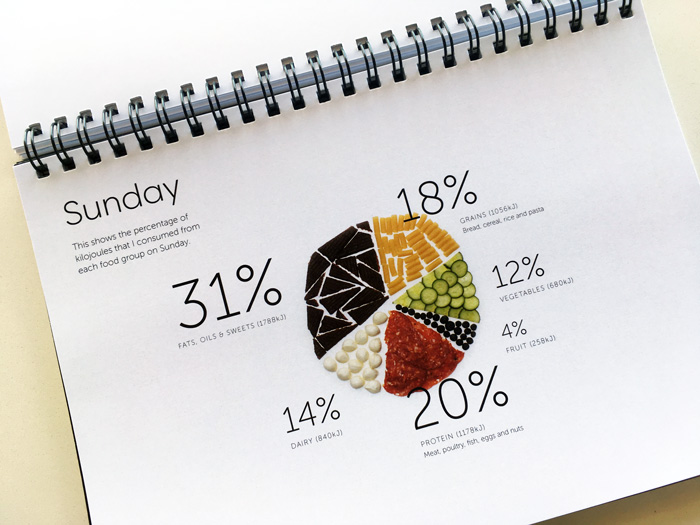
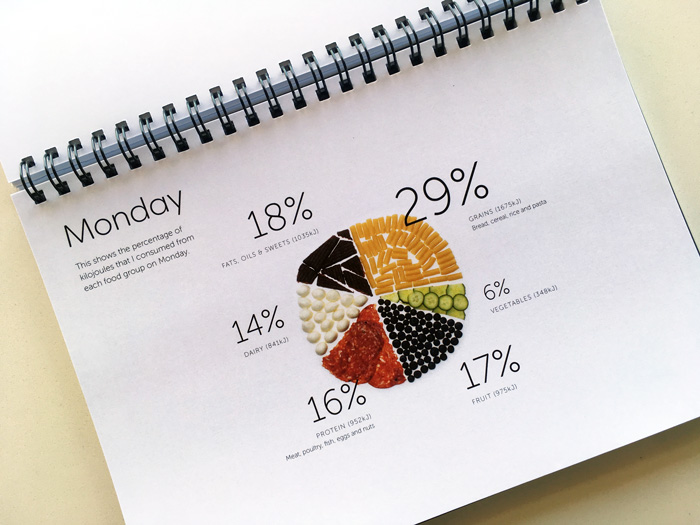
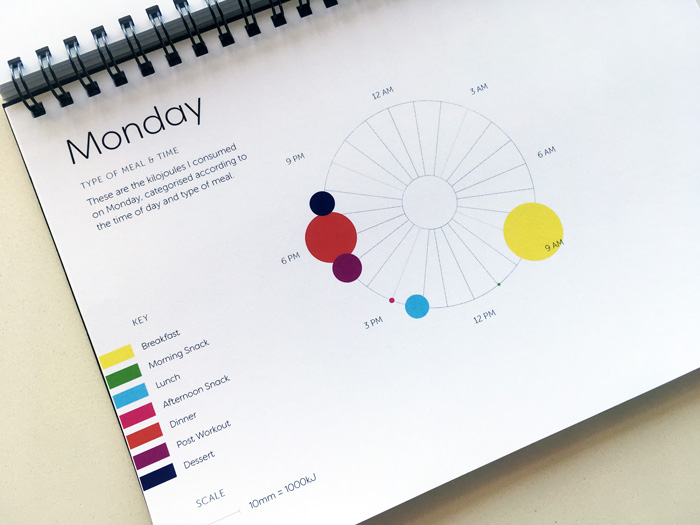
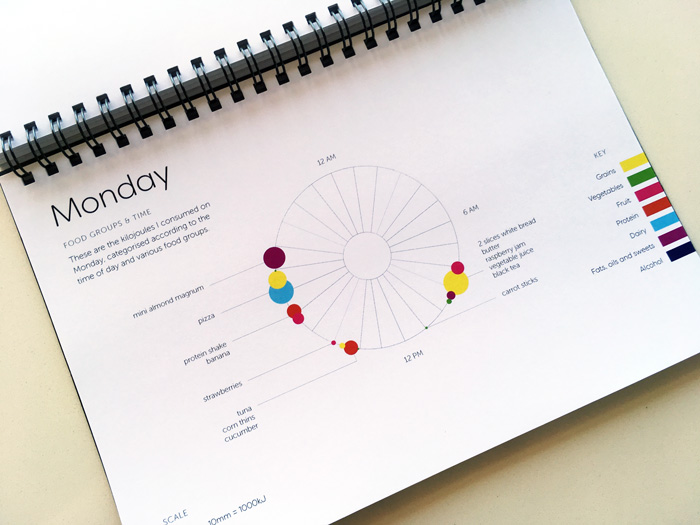
Devoured is a data visualisation project that examines my daily kilojoule intake during a single week. The project looks at the correlation between my kilojoule intake, and other variables such as time of day, type of meal and the various food groups. The wire-bound book format shows each graphic to reader individually, so they can understand the data without feeling overwhelmed.
See the printed book
What type of data is visualised?
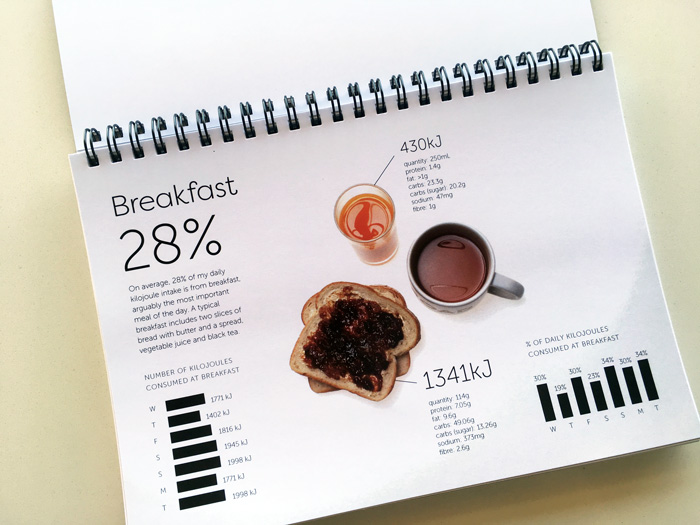
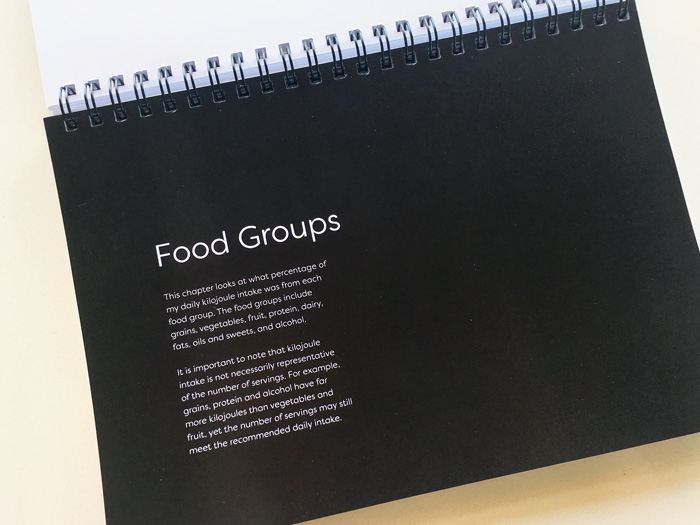
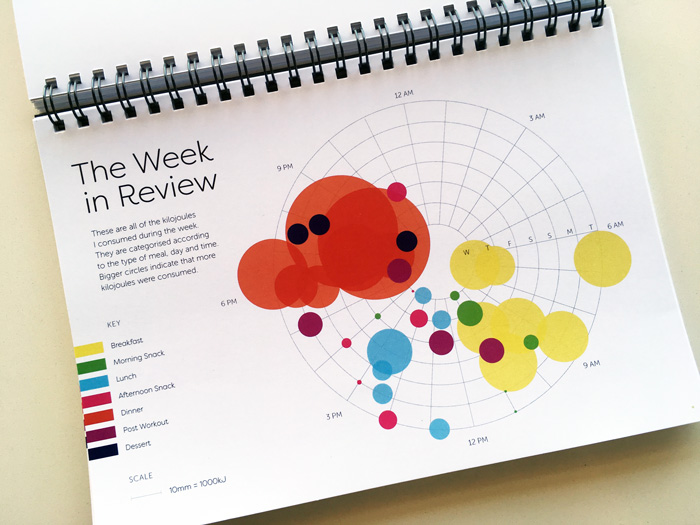
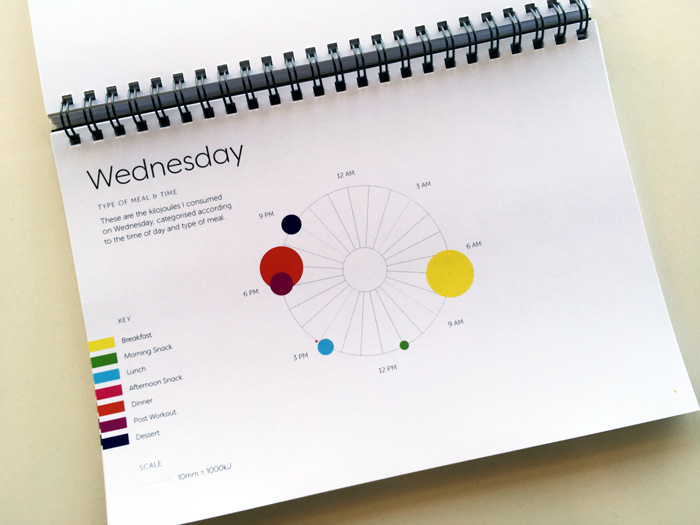
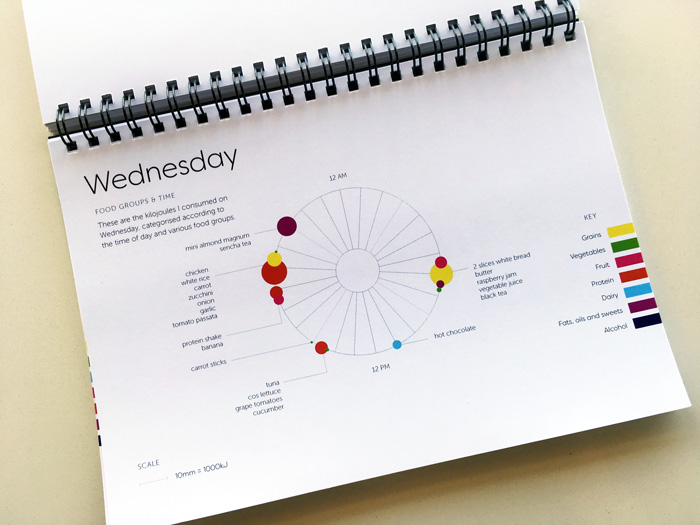
This project visualises my kilojoule intake using three approaches. The first approach looks at my daily meals, and how my kilojoule intake for each meal varied throughout the week. The second approach shows the percentage of kilojoules consumed each day from each food group, and the third compares when different meals and food groups were consumed.
How is it visualised?
A number of different data visualisation techniques are used, including bar, pie, bubble and radar charts. Photographs are used to represent the typical meals eaten in a day, and visualise the amount of kilojoules consumed from each food group. The third section uses positioning, proportion and colour to help the reader understand what I ate, how much and when.
